Section 8 Replication code for Figure 1
The code to reproduce the information of Figure 1 and Table 1 in the article is documented below. Open the figure in a new browser tab for better readability.
library(stm)
library(tidytext)
library(textreadr)
library(ggstance)
library(tidyverse)
theme_set(theme_bw())

# Data ####
load("R/data/res35.rdata")

# Labels ####
topic_label = read_docx("R/data/vaccine_topics.docx") %>% .[startsWith(., "Label")] %>%
    str_sub(start = 8)
topic_relevant = read_docx("R/data/vaccine_topics.docx") %>% .[startsWith(.,
    "Relevant")] %>% str_sub(start = 11)
topic_frex = read_docx("R/data/vaccine_topics.docx") %>% .[startsWith(., "Top 10 FREX words")] %>%
    str_sub(start = 20) %>% str_remove_all(regex("\\((.*?)\\)")) %>% str_remove_all("\\.") %>%
    str_split(",") %>% map(~map_chr(.x, ~str_trim(.x))) %>% map_chr(~paste(.x,
    collapse = ", "))
topic_meta = tibble(topic_label, topic_relevant, topic_frex) %>% mutate(topic = 1:n())

# Prevalence ####
topic_preval = stm_35 %>% tidy("gamma") %>% group_by(topic) %>% summarise(P_topic = mean(gamma))

# Figure 1 ####
topic_meta %>% filter(topic_relevant == "yes") %>% left_join(topic_preval) %>%
    mutate(topic_label = reorder(topic_label, P_topic)) %>% mutate(grp = case_when(topic %in%
    c(20, 2, 12, 8, 23, 6, 11, 9) ~ 2, topic %in% c(27, 14, 32, 7, 30, 3) ~
    1, topic %in% c(10, 5, 25, 31, 21, 24, 17) ~ 3, TRUE ~ 4), grp = factor(grp,
    labels = c("General vaccination\ndebate (24%)", "Specific\nvaccinations (16%)",
        "Practical\nissues (20%)", "Relationship and\ncommunication (19%)"))) %>%
    ggplot(aes(P_topic, topic_label, label = topic_frex)) + geom_barh(stat = "identity",
    color = "black", aes(fill = grp)) + geom_text(hjust = 0, nudge_x = 5e-04,
    size = 3) + scale_x_continuous(expand = c(0, 0), limits = c(0, 0.155), labels = scales::percent_format(accuracy = 1)) +
    labs(y = NULL, x = "Share of corpus", fill = NULL) + scale_fill_manual(values = c("#F781BF",
    "#377EB8", "#FF7F00", "grey20")) + theme(legend.position = "none", legend.background = element_rect(color = "black"),
    legend.key.height = unit(0.5, "cm")) + facet_grid(grp ~ ., scales = "free_y",
    space = "free_y")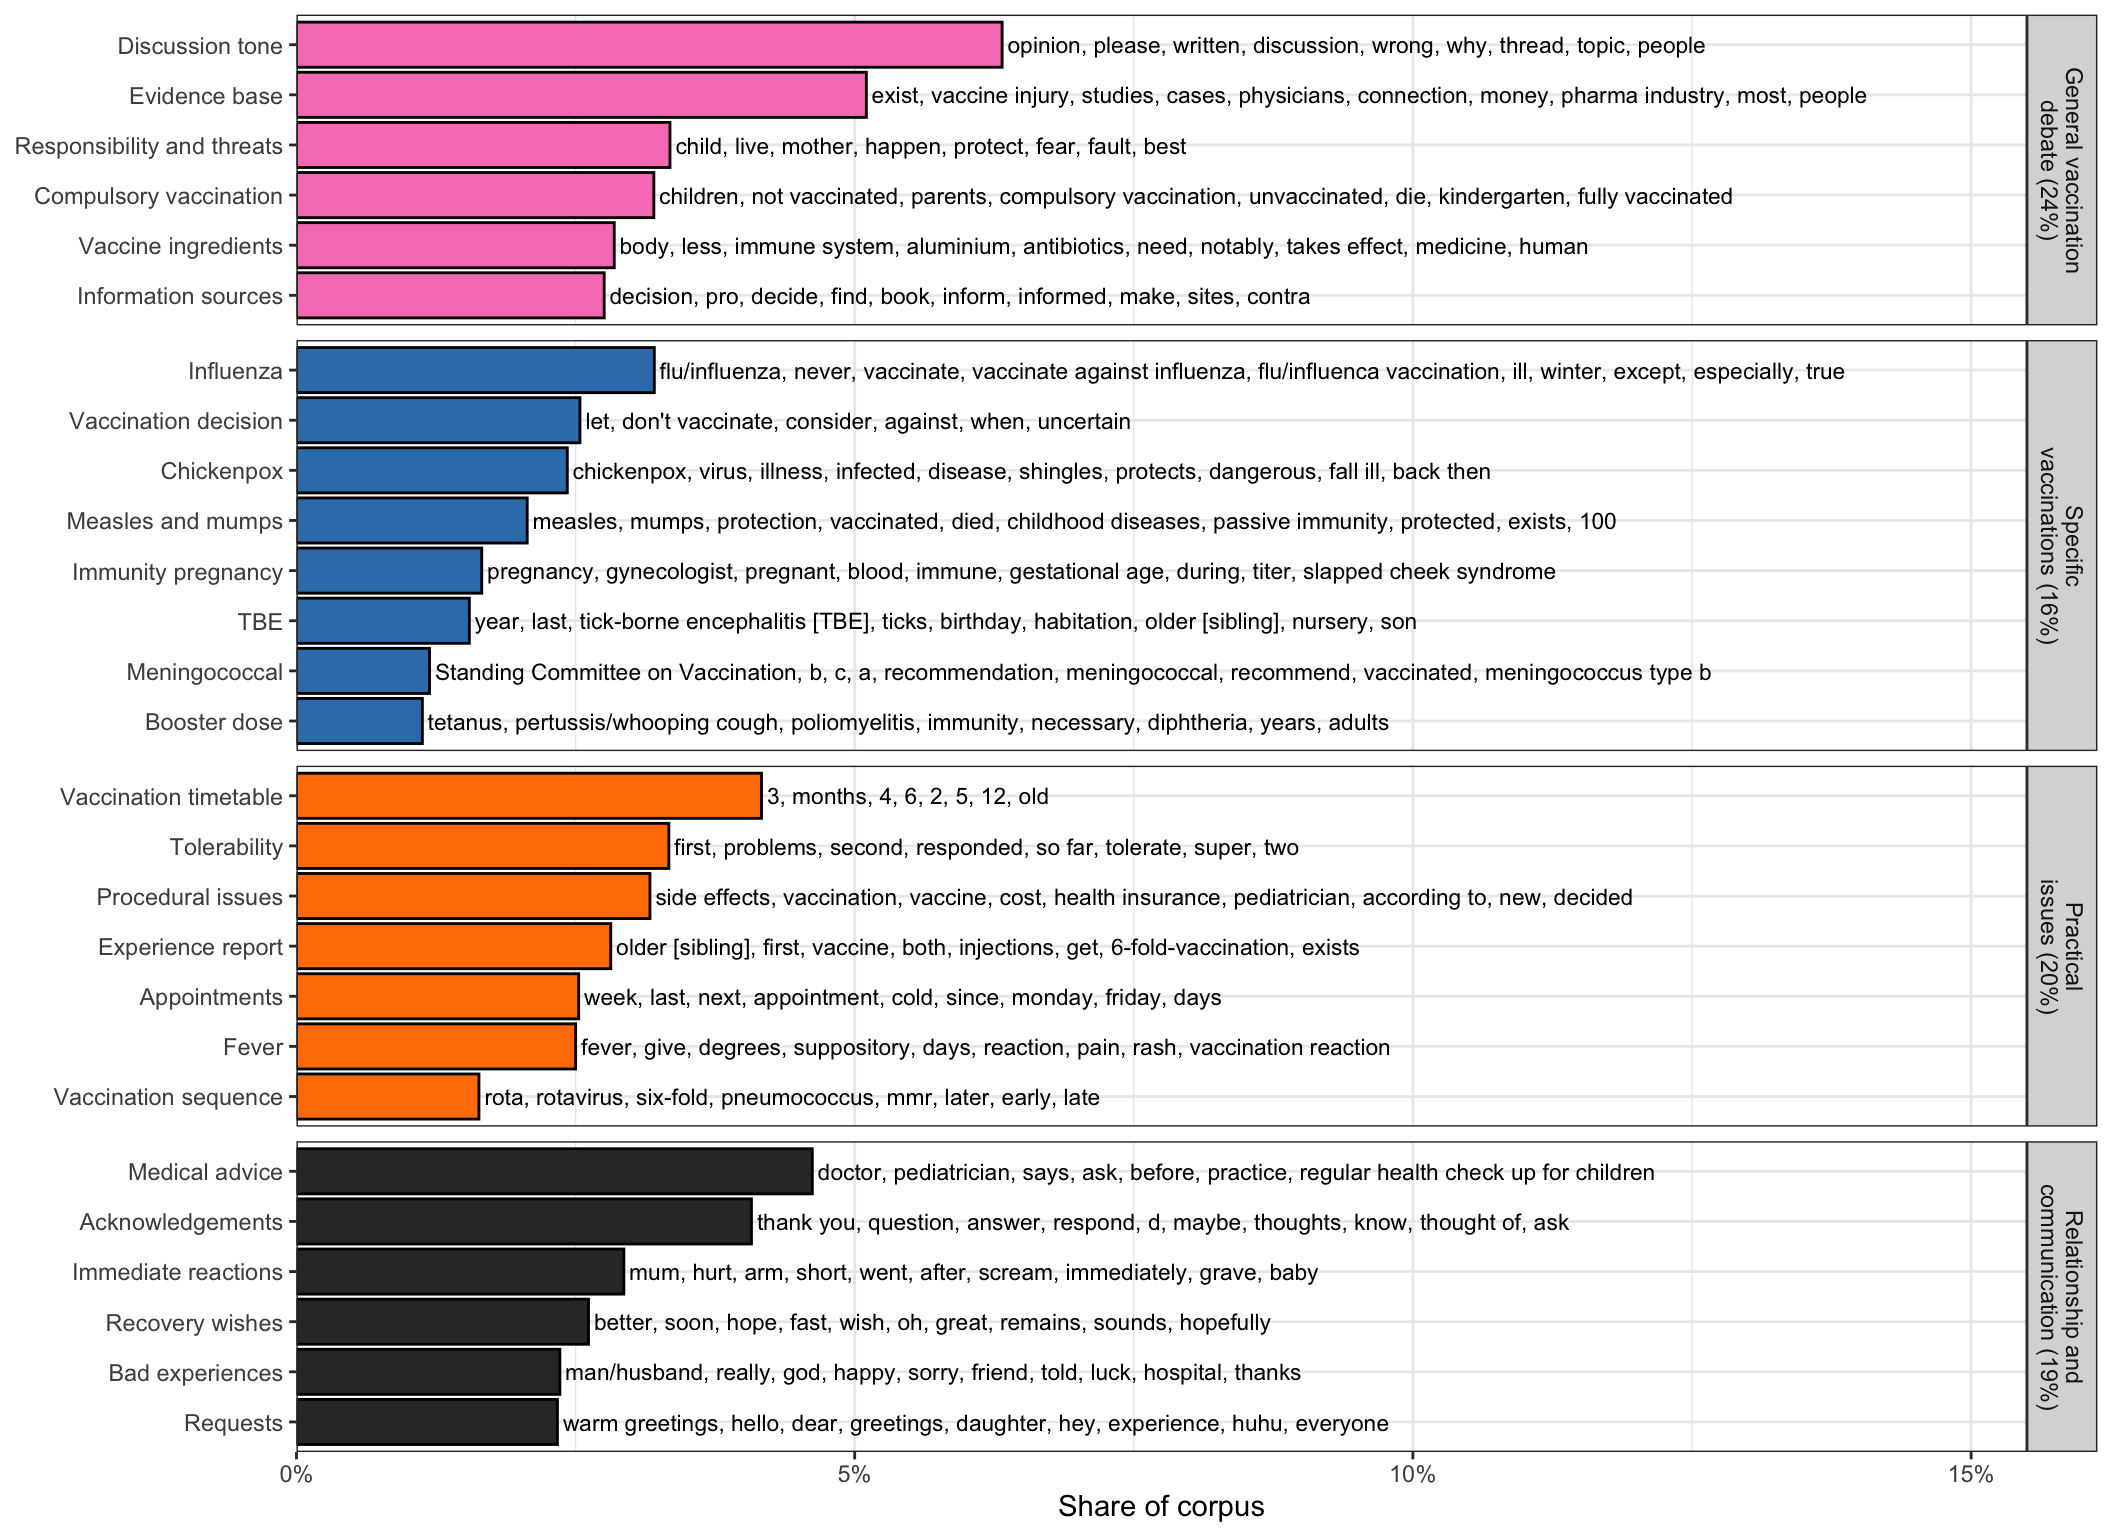
Figure 8.1: Aspects of vaccine-related discussions in online communities for parents